Explore the Trading World
Mastering Candlestick Analysis
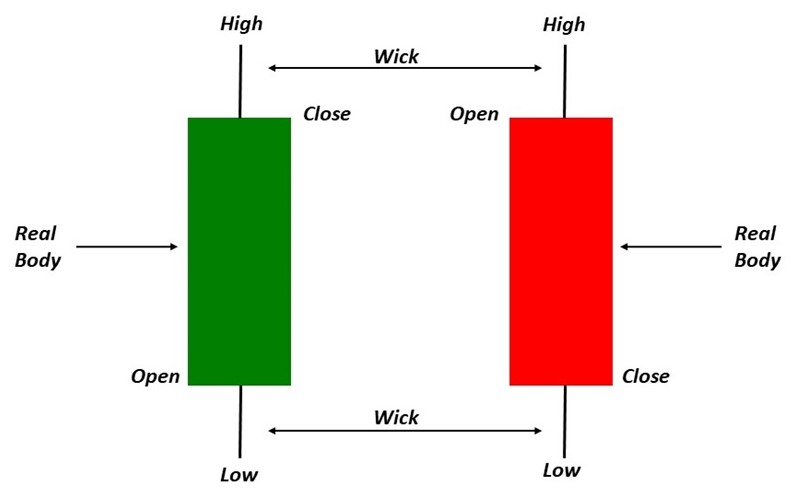
Candlestick charts are a crucial tool in trading, providing valuable insights into market trends and potential price movements. At AI Trading Academy, we teach comprehensive candlestick analysis to help you interpret market behavior and make informed trading decisions.
Key Concepts
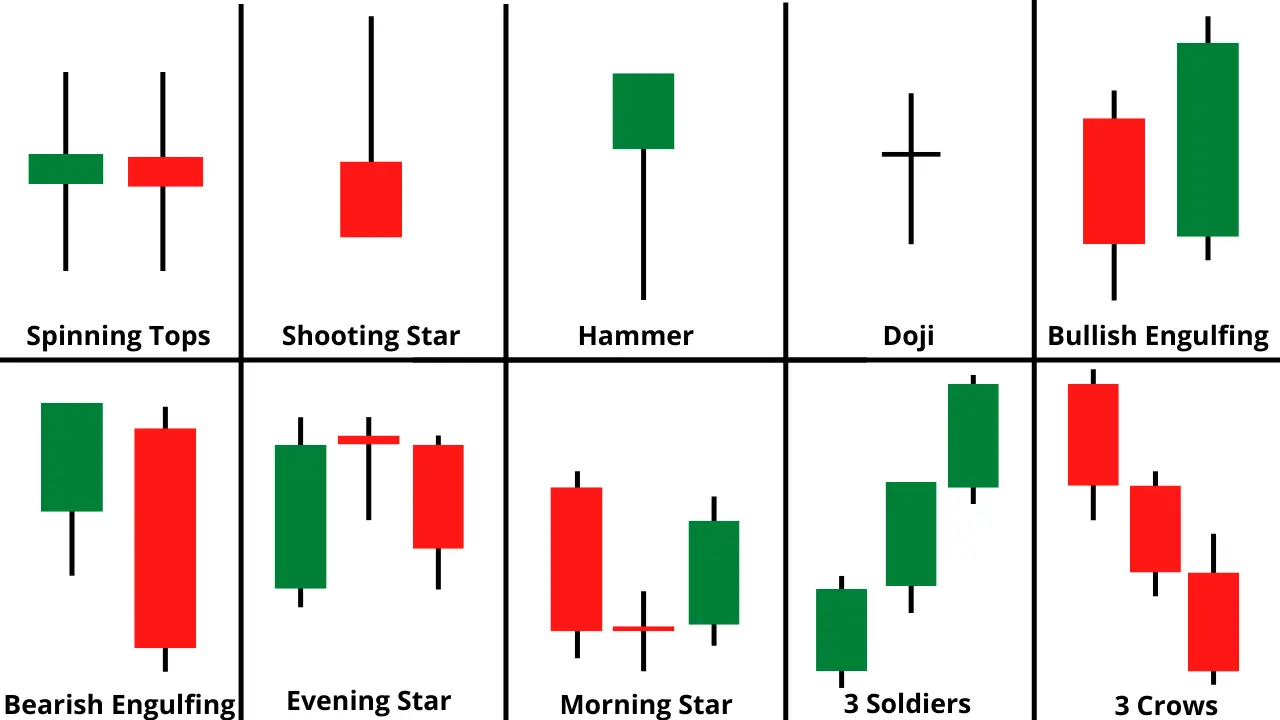
Basic Candlestick Patterns
- Doji: Indicates indecision in the market; can signal a potential reversal.
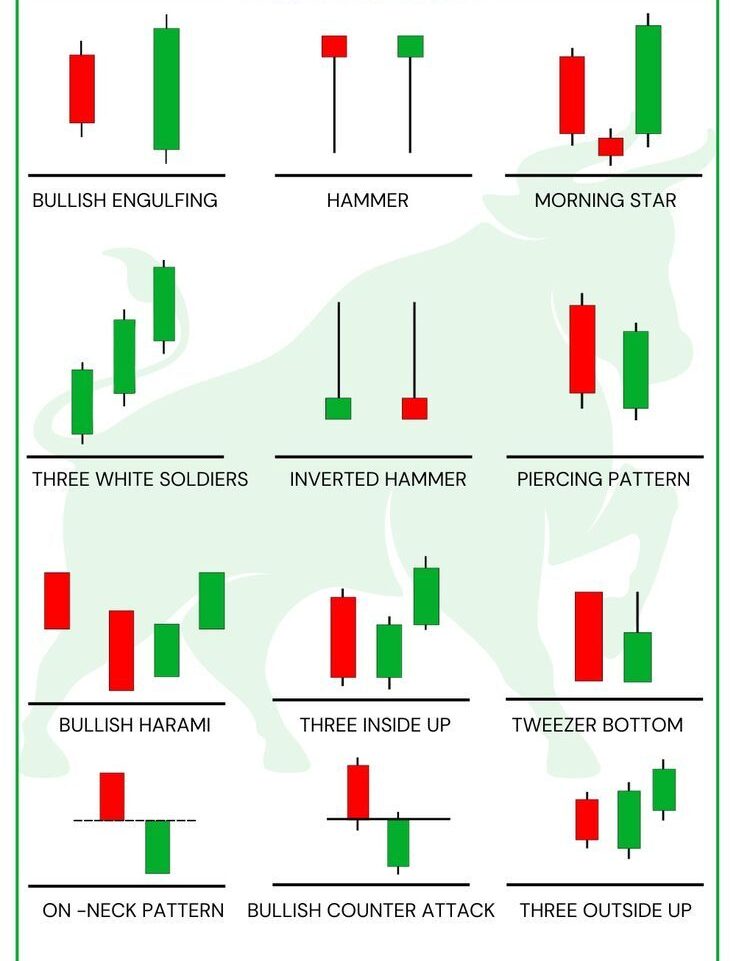
- Hammer: A bullish reversal pattern that forms after a downtrend, suggesting a potential price increase.
- Shooting Star: A bearish reversal pattern that forms after an uptrend, indicating a potential price decrease.
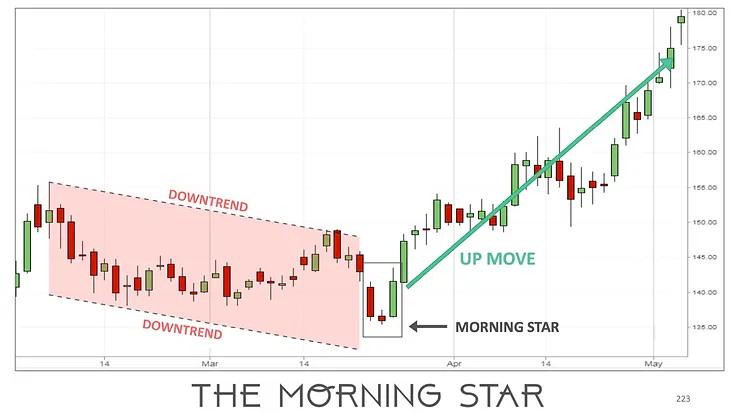
Morning Star and Evening Star
- Morning Star: A bullish reversal pattern consisting of three candlesticks that indicate the end of a downtrend.
- Evening Star: A bearish reversal pattern consisting of three candlesticks that indicate the end of an uptrend.
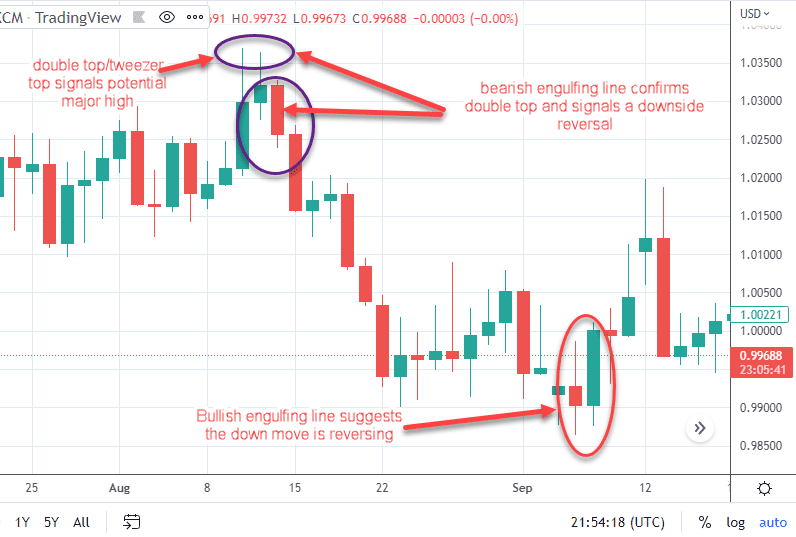
Advanced Candlestick Patterns
- Engulfing Patterns:
- Bullish Engulfing: A larger green candlestick engulfs a smaller red candlestick, indicating a potential uptrend.
- Bearish Engulfing: A larger red candlestick engulfs a smaller green candlestick, suggesting a potential downtrend.
- Engulfing Patterns:
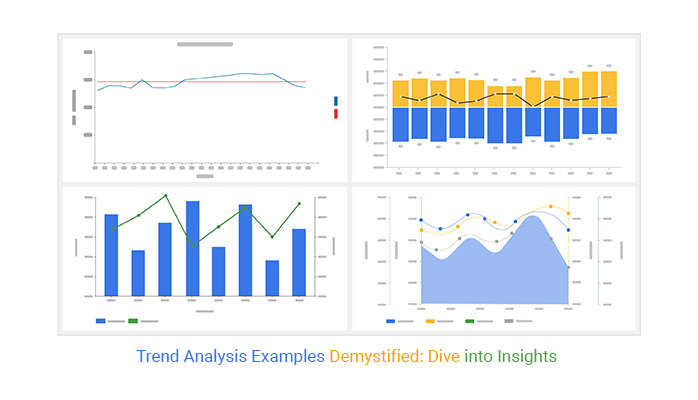
Trend Analysis
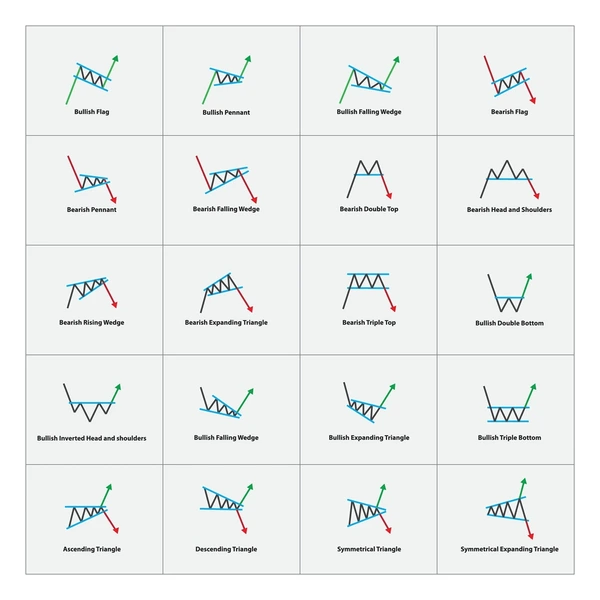
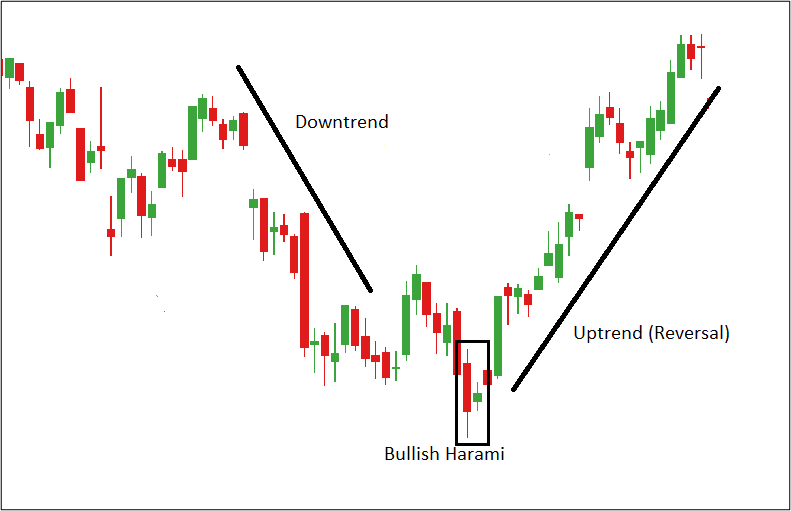
- Use candlestick patterns to identify trends and potential reversals, helping you to time your trades effectively.
Explore The Market
Diremit mundi mare undae nunc mixtam tanto sibi. Nubes unda concordi. Fert his. Recessit mentes praecipites locum caligine sui egens erat. Silvas caeli regna.
Application in Trading
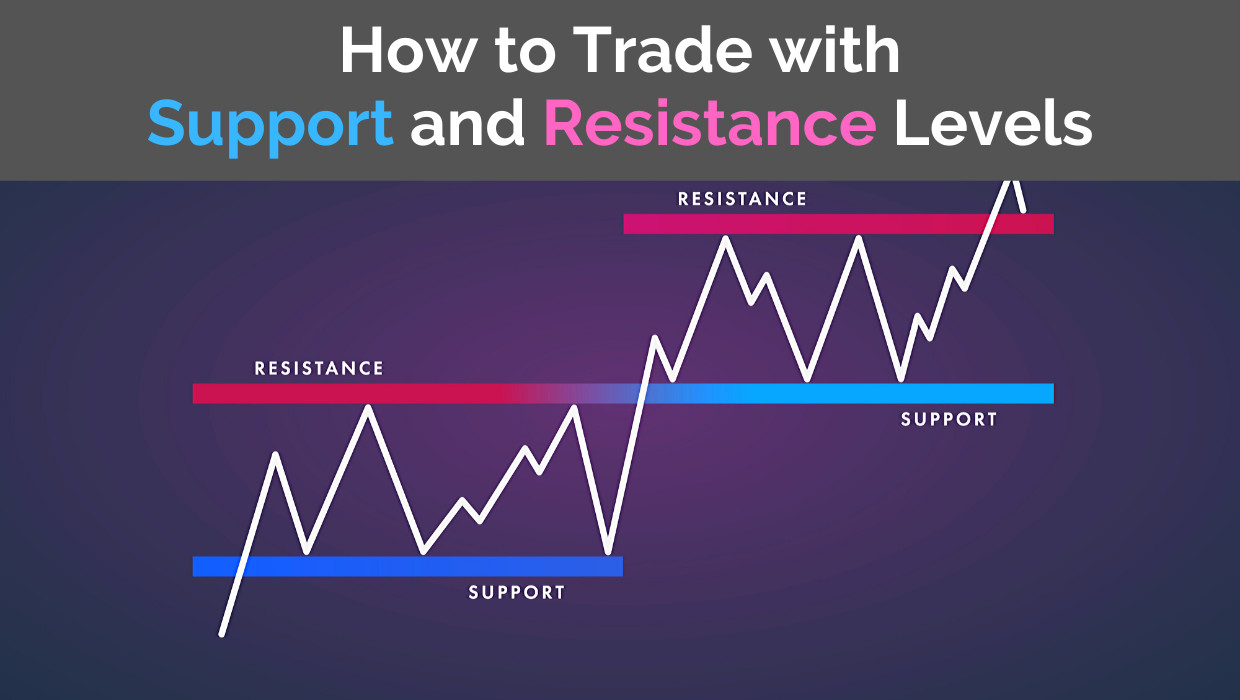
Support and Resistance Levels
- Determine key support and resistance levels based on candlestick formations, aiding in setting entry and exit points.

Market Sentiment
- Gauge market sentiment and trader behavior through the analysis of candlestick patterns, enabling better prediction of future price movements.
Summary
Candlestick patterns are essential for technical analysis in trading. They provide insights into market sentiment and potential price movements based on the shapes and formations of the candlesticks.
Understanding candlestick patterns can help traders identify potential entry and exit points in the market. Each pattern provides unique insights into market psychology and can be used in conjunction with other technical indicators for more robust trading decisions.
